
Article
Sizing a Goods-to-Person Picking System
By David Scelfo, Director of Marketing
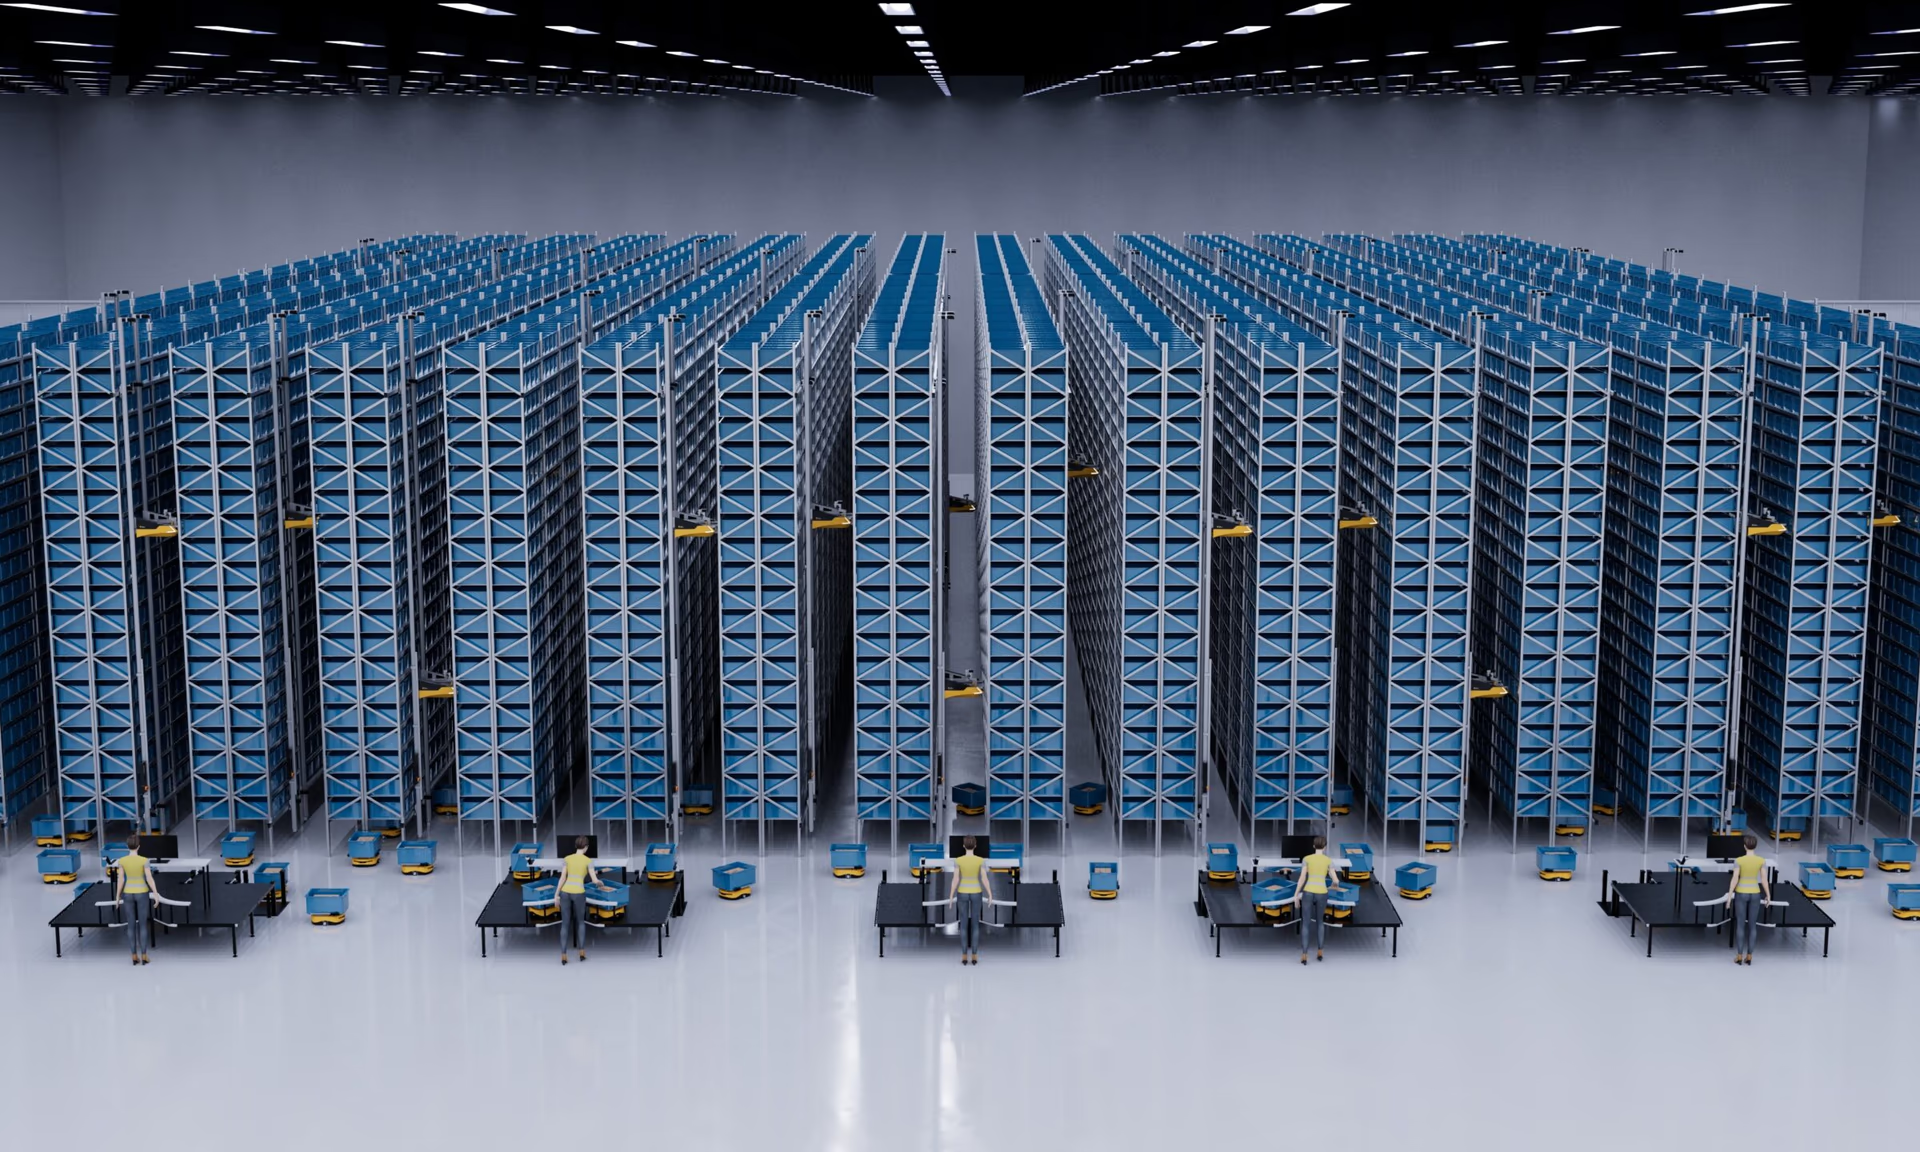
Most goods-to-person projects get sized backwards. A vendor proposes a robot count and a station count, the numbers look plausible, and the operation discovers in month three of live running that peak days stall. The count was never the problem. The inputs behind it were.
There is only one number that sizes a goods-to-person system honestly, and it is order lines per hour at peak. Everything else, stations, robots, storage positions, and the electrical and structural work underneath, follows from it. This guide walks through that chain in order, and flags where the math usually goes wrong. If you want the commercial view of the system itself, see goods-to-person tote systems. For where this technology sits among the automated options, start with types of automated storage and retrieval systems.
Start With Lines Per Hour, Not Robots
An order line is one SKU on one order. It is the unit of work a picker actually performs, and it is the only volume measure that translates cleanly into automation sizing. Orders are a poor input because a one-line order and a twelve-line order are not the same work. Units are a poor input because picking three of something from one container is barely more work than picking one.
So the first number to establish is order lines on your peak day, divided by the hours you genuinely run. Not the hours the building is open. The hours the pick operation is actually staffed and moving, minus breaks and shift changes. Most operations discover their real window is meaningfully shorter than the one they quote, and that shortened window raises required lines per hour immediately.
This is also the point to be honest about growth. A system engineered around today's volume with no headroom will need expansion sooner than the capital cycle allows. The good news is that this class of system expands by adding robots and stations rather than by replacing the installation, so headroom is a phasing decision rather than a permanent over-build.
Lines Per Presentation Is the Ratio That Matters
Here is the input that separates a well-sized system from an expensive one. When a container arrives at a station, how many order lines does the operator satisfy from it before it leaves?
If the answer is one, the station is capped by container arrival rate, and the fleet has to deliver one container for every single line. If batch picking lets the operator pull that same SKU for four different orders in one presentation, the fleet delivers a quarter of the containers for the same output. Nothing about the robots changed. The software and the order profile did.
That is why two operations with identical line volume can need very different fleets. The levers are order profile, how much SKU overlap exists across concurrent orders, and whether the station is configured for batch or wave picking with a put wall or multi-order tote rack. Operations with high SKU concentration across many small orders, which describes a lot of e-commerce fulfillment, benefit most.
Published station rates should be read with this in mind. Rate figures for goods-to-person equipment generally describe container presentations per hour, in the range of several hundred per station depending on the technology. Lines per hour can be considerably higher than presentations per hour when batching works well, and equal to it when it does not. Confirm which number a quote is describing before comparing vendors.
Replenishment Competes for the Same Robots
Picking is not the only work the fleet does. Every inbound receipt has to be put away, and every partially depleted container has to be replenished or consolidated. Those moves use the same robots, travel the same aisles, and frequently occupy the same stations.
Sizing math that counts only pick moves will overstate capacity, and the gap shows up exactly when it hurts: during heavy inbound periods that overlap picking hours. The fix is straightforward. Count total container moves per hour, picking plus replenishment plus putaway, and size the fleet to that combined figure.
Operations that can shift receiving outside the pick window get a real advantage here, because the same fleet serves both functions without contention. That is a scheduling decision worth making before the sizing is fixed, not after.
Peak Is the Number That Sizes the System
A system sized to average volume is a system that fails on the days that matter. Seasonal surges, promotional periods, and the run-up to holidays are precisely when picking capacity determines whether orders ship, and precisely when an under-sized system stalls.
Size to the peak hour of the peak day. Not the peak day's daily average, which hides the intraday shape, and certainly not the annual average. Then ask a second question that rarely gets asked: what happens when peak is exceeded? A well-designed system degrades gracefully, queuing work and running longer. A poorly designed one deadlocks at the lifts or the station buffers.
Peak sizing costs more up front. It is still usually the cheaper decision, because adding robots and stations later is a phased expansion while re-engineering an under-sized installation is a project.
The Decanting Question
Some goods-to-person architectures store product in standardized system bins, which means every inbound item must be transferred out of its shipping carton into a bin before it can be stored. That transfer is called decanting, and it is real recurring labor that belongs in the sizing model.
Quantify it the same way as any other task: inbound units per day multiplied by handling time per unit, converted into labor hours and a headcount. On high-inbound operations it can offset a meaningful share of the picking labor the system saves.
Architectures that store original shipping cartons alongside totes avoid the step entirely. That difference does not show up in a throughput specification, so it has to be added to the comparison deliberately. It is one of the clearer distinctions between grid-based bin storage and rack-mounted systems.
What the Building Has to Give You
Sizing is not finished until the facility is confirmed to support it. Five items get checked early, because each can change the design or the budget:
- Floor slab. Flatness and load capacity both matter more than for conventional racking, because dense storage concentrates load and robot travel is sensitive to surface variation.
- Clear height. This sets how many storage levels you get, which sets storage capacity independent of throughput.
- Electrical capacity and charging. The fleet needs power and physical charging locations, and charging time is fleet capacity that is not available for moves.
- Wireless coverage. Robots depend on continuous network coverage through the entire storage block. Coverage gaps become stalls.
- Fire protection. Driven by commodity class and storage height, and the item most likely to change a project. It needs fire marshal review early, not after equipment is ordered.
Where Sizing Goes Wrong
Five failure modes account for most of the disappointing installations:
- Sized to average, not peak. The system works until the season it was bought for.
- Replenishment omitted. Quoted throughput is picking-only; real throughput is shared with inbound.
- The vertical path undersized. Lifts and vertical travel are a common bottleneck. Fleet size means little if containers cannot move between levels fast enough.
- 100 percent availability assumed. Charging, maintenance, and fault recovery all take robots out of service. Size on realistic availability.
- The bottleneck simply moved. A station that clears 300 lines per hour feeding a pack bench that clears 120 has not solved anything. Size packing, consolidation, and shipping alongside picking.
Sizing Inputs at a Glance
| Input | Where it comes from | Why it drives the size |
|---|---|---|
| Order lines at peak | Order history, peak day and peak hour | The root number everything derives from |
| Real operating hours | Staffed pick window, minus breaks and shift change | Shortens the window, raises required rate |
| Lines per presentation | Order profile and batch picking configuration | Largest single lever on required fleet size |
| Replenishment and putaway moves | Inbound receipts and container depletion rate | Consumes the same robot capacity as picking |
| SKU count and container mix | Item master, dimensions and weights | Sets storage positions and container sizing |
| Growth horizon | Business plan, capital cycle | Determines phasing rather than over-build |
| Robot availability | Charging, maintenance, fault recovery | Converts theoretical fleet capacity to real |
| Downstream capacity | Pack, consolidation, shipping rates | Prevents relocating the bottleneck |
| Building constraints | Slab, clear height, power, network, fire | Can change the design or the budget entirely |
One System, One Point of Responsibility
A goods-to-person installation is not a robot purchase. It is the racking the system is built on, the workstations, the controls and software interfaces, the electrical work, the fire protection, and the permitting. In practice these projects stumble at the interfaces far more often than at the robots, and most often where the software meets the warehouse management system, or where the structure meets the building code.
Hammerhead delivers the complete system as integrator and general contractor. We model the sizing case with you first, working from your real order lines rather than a proposed equipment count, then own the rack structure, permitting, fire protection coordination, controls integration, and installation around whichever technology fits. If the honest answer is that your volume does not justify automation yet, and that better slotting, a carton flow pick face, or a pick module returns more per dollar, we will tell you that before you spend the capital.
If you are evaluating goods-to-person picking, talk to us and we will build the sizing model with you.
Frequently asked questions
How many pick stations does a goods-to-person system need?
Work backwards from order lines. Divide your peak-day order lines by the hours you actually run to get required lines per hour, then divide that by the lines per hour one station sustains. The station rate is not a fixed number: it depends heavily on how many order lines each presented container satisfies. If every tote serves one line, the station rate is capped by how fast containers arrive. If batch picking lets one tote serve three or four lines across several orders, the same station clears several times the work without a single extra robot. Size the station count on the batched rate you can realistically achieve, not the theoretical presentation rate.
Should I size a goods-to-person system to average or peak volume?
Peak, and specifically the peak hour of the peak day rather than the peak day's average. A system sized to annual average volume will look correct on a spreadsheet and fail every seasonal surge, which is exactly when order picking capacity matters most. The standard approach is to size stations and robots to sustain the peak hour, then confirm the system degrades gracefully rather than stalling if peak is exceeded. Sizing to peak costs more up front, but a goods-to-person system is expanded by adding robots and stations, so it is usually cheaper to size honestly and phase the build than to under-size and retrofit.
Does replenishment reduce goods-to-person picking throughput?
Yes, and it is the most commonly missed input in sizing. Putaway and replenishment moves use the same robots and often the same stations as picking. If your sizing math only counts pick moves, the system will underperform its quoted throughput in production because a real share of robot capacity is doing inbound work. Count total container moves per hour, both picking and replenishment, and size to that combined number. Operations that receive heavily during picking hours feel this most.
What does the building need to support a goods-to-person system?
Four things get checked early: floor slab flatness and load capacity, since dense storage and robot travel are less forgiving than conventional racking; clear height, which sets how many storage levels you get; electrical capacity and charging locations for the robot fleet; and wireless network coverage through the whole storage block, because the robots depend on it. Fire protection is a separate and more serious question, driven by your commodity class and storage height, and it needs fire marshal review early rather than after equipment is ordered.
What is the difference between sizing for throughput and sizing for storage?
They are independent, and that is the main advantage of this class of system. Storage capacity comes from the rack: positions, levels, and container size. Throughput comes from the robots and stations moving containers to operators. You can add storage without adding throughput, or add robots and stations without adding a single storage position. Conventional picking cannot separate the two, because more inventory spread over more space means more picker travel. Size the two independently against your real SKU count and your real order profile.
How do you calculate goods-to-person throughput?
Start with required lines per hour at peak. Divide by lines per presentation, the number of order lines one delivered container satisfies, to get required container presentations per hour. Add replenishment and putaway moves, because they consume the same robot capacity. That combined figure is what the fleet has to sustain. Then divide the presentation requirement by the rate a single station can absorb to get station count, and size the robot fleet to keep every station fed at that rate given your travel distances and storage height.